Fundamental Research Platform
Decode any business.Thirty years of data, AI-scored.
Valuation, profitability, capital structure and dividend quality — unified in one platform built for investors who think in decades, not quarters.
◆Free to start◆No credit card◆30Y financial history◆REIT FFO mode
Financial history
30Y
Income · Balance · CF
Metrics tracked
50+
Per company
Companies
6,000+
US · CA · UK · PT
Core access
Free
Sign up in 30s
◆dividend-line.com/analysis/MSFT
Summary
Updated daily
30Y · AI scored
6,000+ companies covered · 30 years of financials from company filings · one lens
What sets it apart
Built for long-term, fundamentals-based investing
Three principles that shape every screen, every chart, every metric on the platform.
◆ Depth
Up to 30 years of financial history
Income statements, balance sheets and cash flows going back three decades — see how a business performs across full economic cycles, not just a quarter.
30Yof statements per company
◆ Coverage
Full fundamental coverage
Valuation, profitability, capital structure, payout ratios and fair value — every dimension of a business, with AI-driven moat and quality scoring layered on top.
50+metrics tracked per company
◆ Dividend Quality
Properly measured payout, not EPS theater
Payout ratios built on Free Cash Flow and FFO — not EPS. AI-evaluated dividend safety, growth streaks, forward estimates and coverage analysis. Dedicated FFO mode for REITs.
FCF+ FFO mode for REITs
The platform
Four research modules, one terminal
Every module shares the same data layer — switch between analysis, screening, portfolio and projection without losing context.
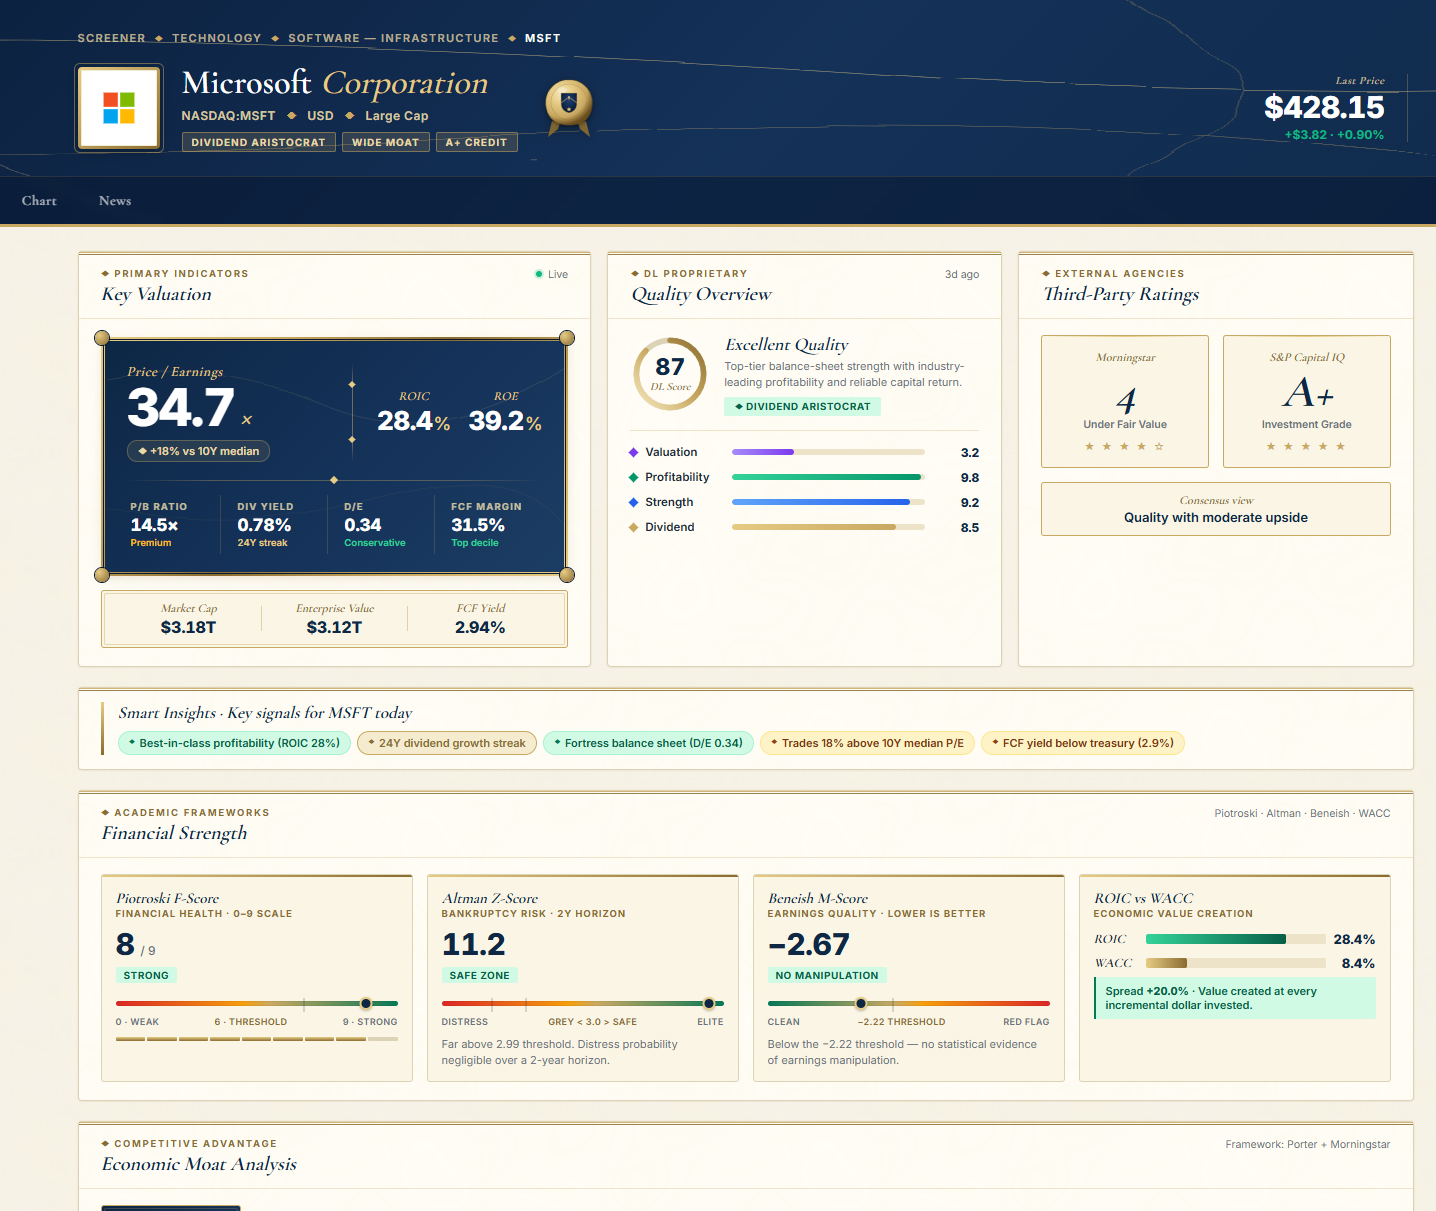
Three decades of income, balance sheet and cash flow. Valuation, profitability, margins, capital structure and dividend quality — unified into a single company page.
Open analysis→Filter 6,000+ companies by valuation, quality, growth, leverage and yield, around 60 filters in all. Nine one-click guru strategies, from Buffett-Munger and the Magic Formula to Dividend Aristocrats and Deep Value.
Open screener→Build a model portfolio, track allocations, monitor dividend income and watch how cash flow compounds across years. Valued at each day's close, in any mix of currencies.
Open portfolio→Calculator
Compound Calculator
Project portfolio growth through contributions, dividend reinvestment, yield and appreciation across decades. Sensitivity scenarios for retirement income planning.
Open calculator→How it works
A research workflow, refined
From the universe of public companies to your model portfolio in three deliberate steps.
I
Find quality companies
Use the screener to surface businesses with the right quality, yield, growth and valuation profile.
II
Analyse the business
Review decades of profitability, capital structure, dividends, valuation and moat durability.
III
Build your portfolio
Add ideas to a model portfolio, track allocations and watch your dividend income compound.
◆ Dividend growth investors◆ Value investors◆ Quality-focused investors◆ Retirement income planning◆ REIT specialists
Popular companies
Jump directly into a full company analysis.
Under active development
An evolving research ecosystem
Something new ships most weeks. Recently: long-form X-Ray Analyses, a written moat verdict and Buffett Take on US companies, a verdict on each earnings release, and fund holdings read straight from SEC 13F filings. Tell us what's missing. The founder reads every email.
Access model
A free account, for good
Three company analyses a day, a portfolio of up to 10 holdings, the calendar, macro and every X-Ray report. No card, no expiry. Premium lifts the limits from $16.58/month billed yearly, with a 7-day free trial.
Start today
The best way to understand the platform is to use it.
Open a company, explore thirty years of fundamentals, test the screener and see how Dividend Line becomes part of your research workflow.