ExxonMobil
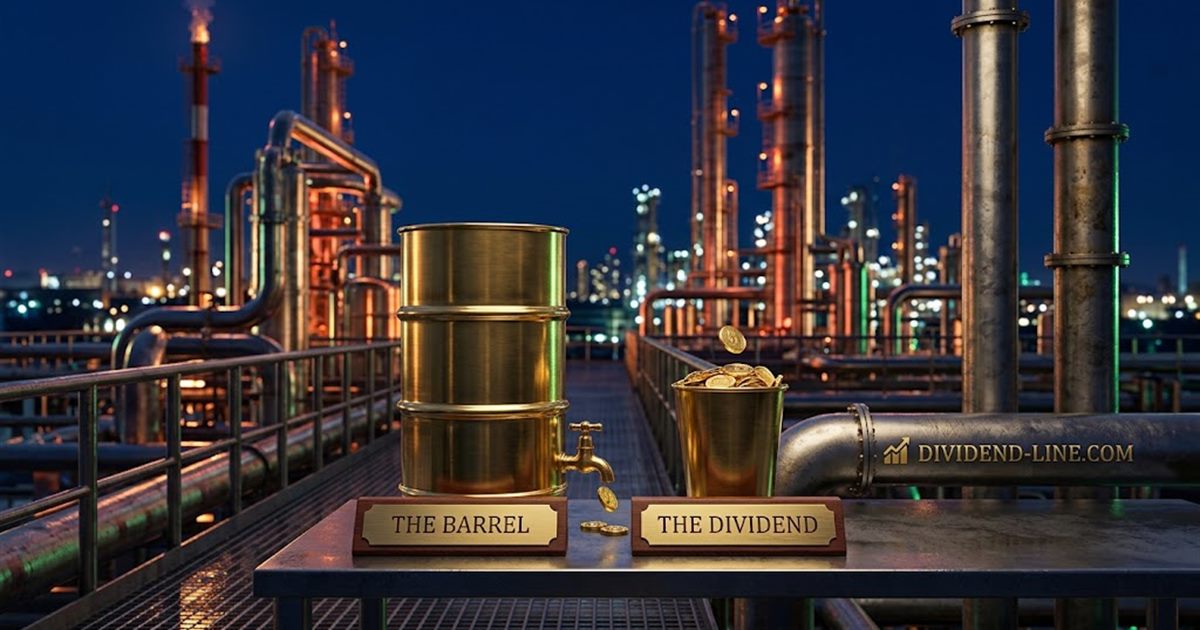
The business, in plain English
What it does · where the money comes from · where it is exposed
ExxonMobil finds oil and gas, pumps it, refines it into fuels, turns some of it into chemicals and plastics, and sells all of it at prices set by the world market. It is the largest Western oil company, worth about $665 billion, producing about 4.5 million barrels of oil equivalent a day. In 2025 it booked $324 billion of revenue and $28.8 billion of profit.
Most of the revenue comes from selling fuels; most of the profit comes from the ground. In the second quarter of 2026 the Upstream business — oil and gas production — earned $7.9bn of the $14.5bn total, Energy Products (refining) $5.5bn, Chemical Products $1.1bn and Specialty Products (lubricants and the like) $956m.
Three places matter most. The Permian Basin of Texas and New Mexico, much enlarged by the purchase of Pioneer Natural Resources in 2024, now produces a record 1.8 million barrels a day. Guyana, where Exxon operates the Stabroek block — one of the great oil discoveries of the century — adds a fifth production ship in the fourth quarter. And the Middle East, where assets in Qatar and the United Arab Emirates made up about 20% of Exxon's production before the war with Iran began in late February.
Shares of Q2 2026 GAAP earnings; corporate and financing costs of −$954m make the total 100%.
★★ What Exxon earns — and what the oil price earns for it
An ordinary year, a war year, and the cash in between
The first chart is the whole analysis. ExxonMobil lost $5.25 a share in 2020, when Brent averaged about $42, and earned $13.26 in 2022, when it averaged about $99. The company did not become two and a half times better in two years. The price of oil moved. Over the last five years, with Brent averaging about $80, Exxon earned on average $8.42 a share. In 2025, at $69 oil, it earned $6.70. Analysts expect about $12 this year.
This year's price is a war price. The United States and Israel began military operations against Iran in late February; fighting in and around the Strait of Hormuz has cut the flow of Gulf oil and gas ever since. Brent averaged about $81 in the first quarter and about $104 in the second, and closed above $101 on 9 September after new attacks on shipping. Exxon is both a winner and a casualty: its Permian and Guyana barrels sell for more, its refineries earn wider margins — and its own Middle East assets, about a fifth of its production, were disrupted, with two Qatar LNG trains in which it holds interests damaged by missile strikes and a repair estimated by QatarEnergy at three to five years.
Why the first quarter looked weak (§5.7). Exxon hedges and trades physical cargoes. When prices jump, contracts are marked at the new price before the barrels they cover are sold — "timing effects". In the first quarter these, with other one-off items, cut reported earnings to $1.00 a share against $2.09 adjusted. In the second quarter the effects reversed and one-offs — $1.1bn of impairments and further charges — roughly cancelled out: $3.48 reported, $3.52 adjusted. A trailing P/E of 20.7× mixes all this and means little. The honest yardsticks are the war-year estimate and the ordinary-year average.
Where the 2025 cash went. At $69 oil Exxon generated $52.0bn from operations, spent $28.4bn on projects, and was left with $23.6bn of free cash flow. The dividend took $17.2bn — covered 1.4 times. Buybacks took another $20.3bn. The gap of nearly $14bn was met mostly by running cash down from $23.0bn to $10.7bn. That is fine once, from a strong balance sheet. It is not a pace that $69 oil can pay for every year — and it means the war, not the ordinary business, is paying for this year's $20bn buyback pace.
The moat
A price-taker's advantages — real, but narrower than a brand's
An oil company cannot have the moat Coca-Cola has; nobody pays more for Exxon's barrel. What it can have is lower costs than the next producer, so that it earns more at every price and survives the troughs that kill weaker rivals. Exxon's advantages are of that kind:
Low-cost, long-life barrels. The Permian and Guyana are among the cheapest large sources of new oil in the world. Integration. When crude is cheap, the refineries and chemical plants earn more; when it is dear, production does — the businesses partly hedge each other. Scale and discipline. Exxon reports $16.3bn of structural cost savings since 2019. The balance sheet: net debt of just 10.7% of capital, which let it keep paying the dividend through 2020 when others cut.
The limits are just as plain. Exxon lost the Guyana arbitration in 2025, when it tried to block Chevron's purchase of Hess's 30% of Stabroek. Its Middle East assets are, this year, a reminder that a fifth of production sits in a war zone. And the long-run demand for its main product is a question no one can answer with confidence. We score the moat 6: best in class, in a class without moats.
Management & ownership
Verified on the day of writing
The move to Texas. On 1 July 2026 ExxonMobil completed its move from New Jersey to Texas: every share was exchanged for a share of a new parent, ExxonMobil Holdings Corporation, with new articles and by-laws and a smaller board. Shareholders approved it at the annual meeting. Texas law gives companies more room to limit shareholder proposals and lawsuits; for an owner, that is a small loss of voice rather than of value.
Ownership is broad and institutional — the index giants lead, with State Street reporting 5.0% in August. Insider trading is minor: one officer sold about 10,800 shares between February and March at $140–158.
The numbers — and four things our feed gets wrong
Sourced from the live pull · TTM unless noted
| Metric | Value | Read |
|---|---|---|
| EPS 2025 · H1 2026 adjusted · 2026e | $6.70 · $5.60 · $11.99 | ◆ The war doubles the run-rate |
| Five-year average EPS (2021–25) | $8.42 | ◆ Brent averaged ~$80 |
| Operating cash flow · FCF, Q2 2026 | $23.6bn · $17.2bn | ▲ A war quarter |
| Capex, 2026 plan | $27–29bn | ◆ Growth in Permian, Guyana, LNG |
| Net debt / capital · interest cover | 10.7% · 60× | ▲ The strongest of the majors |
| Return on capital employed | 10.3% | ◆ Cyclical |
| Buybacks, H1 2026 | $10.0bn | ◆ ~$20bn a year pace |
| What the feed says | Value | What is true |
|---|---|---|
| Trailing P/E | 20.7× | Mixes a quarter depressed by timing effects ($1.00) with a war quarter ($3.48). Use 13.4× (2026e) and ~19× (five-year average). |
| DCF value | $113.75 | −29%. A DCF on a price-taker is a forecast of the oil price in disguise. Not used. |
| Stock-based compensation, 2024–25 | $0 | Exxon pays executives largely in restricted stock; the feed shows $611m for 2023 and nothing since. A gap in the data, not in the pay. |
| Beneficial owners | Exxon, Pioneer entities | Filings by the company and its own subsidiaries after the Pioneer deal, not outside owners. |
The dividend
Does the barrel pay it? At far lower prices than today's
ExxonMobil pays $1.03 a quarter, $4.12 a year — a 2.6% yield at today's price — and has raised its annual dividend for 43 consecutive years, the last time by 4% in October 2025. It kept paying through 2020, borrowing to do so. The next increase would normally be declared with third-quarter results in late October.
The test that matters is not this year. At war prices the dividend takes about a third of earnings. The question is whether it survives an ordinary year and a bad one. In 2025, at $69 oil, free cash flow of $23.6bn covered the $17.2bn dividend 1.4 times. In 2020, at $42 oil, it did not, and Exxon borrowed. With lower costs, a larger Permian and Guyana, and net debt of only 10.7% of capital, our judgement is that the dividend is safe well below today's prices — and that what would give way first in a downturn is the buyback, which is as it should be.
| Dividend test | Value | Read |
|---|---|---|
| Payout of 2026e EPS (war prices) | ~34% | ▲ Ample |
| Payout of 2025 EPS ($69 oil) | ~61% | ▲ Covered |
| FCF cover, 2025 | 1.4× | ▲ Before buybacks |
| Dividend + buybacks vs FCF, 2025 | $37.5bn vs $23.6bn | ▼ Buybacks drew on cash |
| Consecutive annual increases | 43 | ▲ Aristocrat |
Risks, lawsuits & controversies
Verified afresh, 27 September 2026
First, the price of oil. This is the risk that dwarfs the others. If the Strait of Hormuz reopens and Gulf production recovers — the US Energy Information Administration expects Middle East output to stay below pre-war levels until the second quarter of 2027 — Brent could return to the $70s, where Exxon earned $6.70 last year. Goldman Sachs forecasts $80 for 2027; it also warns of $120 if Gulf output stays four million barrels a day below normal. An owner at $161 is exposed to both.
Second, the courtroom. ① California's attorney general sued Exxon in September 2024, alleging decades of deception about the recyclability of plastics, and seeks penalties and an injunction; the case is pending. Exxon sued the attorney general for defamation in Texas; in February 2026 a federal judge let that case proceed against him personally, and he has appealed. ② Exxon remains a defendant in a series of state and municipal suits alleging it misled the public about climate change; none has reached a damages verdict. ③ A settlement with Louisiana and coastal parishes over marsh erosion claims took effect on 31 July 2026; Exxon describes it as not material. ④ The second-quarter results included about $1.2bn of financial reserves in Upstream and $1.2bn of impairments and hedge losses linked to the Middle East, the kind of charges wars leave behind.
Third, capital. Capital spending of $27–29bn this year is 20% above the next Western major's by Exxon's own account. It is productive spending on low-cost barrels — but it is committed through the cycle, while oil prices are not.
★ Valuation
Value it on an ordinary year — the only kind that lasts
| Yardstick | Value | Reading |
|---|---|---|
| Share price · market value | $160.59 · ~$665bn | 52-week range $110.39–$176.41. |
| P/E — 2026e · 2027e · 2028e | 13.4× · 14.5× · 15.4× | Consensus EPS falls from $11.99 to $10.43 as analysts expect oil to ease. |
| P/E — five-year average EPS ($8.42) | ~19× | Full for a cyclical: the price already assumes oil well above its recent norm. |
| FCF yield — TTM · 2023–25 average | 4.6% · ~4.4% | TTM includes the war quarter; 2023–25 averaged ~$29bn a year. |
| Dividend yield | 2.6% | Exxon has often yielded 3.5% or more over the last decade. |
| Our value range | ~$125–145 | 15–17× the five-year average EPS; cross-checked at a 5–5.5% yield on ~$7 of average FCF a share. |
| Street target (mean · median) | $168.08 · $177 | Range $90–185 — a wide spread, as it should be for a price-taker. |
What does $161 assume? Either that oil stays near $90–100 for years, or that Exxon's Permian and Guyana growth and cost savings lift ordinary-year earnings well above $8.42 quickly. The second is partly true — production is at a twenty-year high and costs are lower — but not enough to justify paying 19 times an ordinary year for a business that will, at some point, have another 2020. We said the same of Chevron in July: buy the crash, not the spike.
There is a simple way to understand ExxonMobil. In 2020 it lost five dollars and twenty-five cents a share. Two years later it earned thirteen dollars and twenty-six cents. It was the same company, run by the same people, pumping from much the same fields. What changed was the price of oil, which Exxon does not set and cannot predict any better than you or I.
That is the first thing an owner must accept, and it is why I value an oil company on an ordinary year rather than on the year in front of me. Over the last five, with oil averaging about eighty dollars, Exxon earned about eight dollars and forty cents a share. Last year, at sixty-nine dollars, it earned six-seventy. This year, with a war closing much of the Strait of Hormuz and Brent near a hundred, analysts expect about twelve.
Let me say plainly what is good here, because there is a great deal. This is one of the best-run oil companies in the world. Its balance sheet is the strongest among the majors, with debt of barely a tenth of its capital. Its Permian fields produce more than ever; its Guyana fields are among the cheapest sources of new oil on earth. It has cut sixteen billion dollars a year of costs since 2019. And it has raised its dividend for forty-three years in a row, through wars, crashes and a pandemic. I have no worry about that dividend at prices far below today's.
My worry is the share price. At a hundred and sixty-one dollars you are paying about nineteen times what Exxon earns in an ordinary year. That is a price for a business whose earnings compound steadily. Exxon's do not; they rise and fall with a commodity, and this year they are rising on a war that will, one hopes, end. When it does, the earnings will fall back, and the share price will likely follow. Last year, when the company paid out more in dividends and buybacks than it generated, it drew on its savings — a sensible thing to do once, but a reminder of what an ordinary year really pays for.
So my advice is patience. Do not buy the war. The time to buy an oil company is when the oil price is low, the headlines are gloomy and the yield is fat — for Exxon, around a hundred and thirty dollars, where the dividend yields more than three per cent and the price is about fifteen times an ordinary year. If you already own it, there is no reason to sell a fine company with a safe dividend; simply do not add at a war price.
— The Buffett Lens · Dividend Line Research · valuing the barrel at peace, not at war
Don't Buy the WarOne of the best-run oil companies in the world, with a safe 43-year dividend and the strongest balance sheet among the majors. But at $160.59 you are paying ~19× an ordinary year's earnings while Brent near $100 on a war props up this year's. Our value range is ~$125–145. Owners can hold; new money should wait. Start near ~$130 (3.2% yield). Q3 results and the usual dividend increase due late October.
You've just read ExxonMobil the way we read every company.
The terminal that produced these numbers is free to use: 30 years of statements drawn as flows, a screener built around moats, Buffett's Desk, and an earnings feed read through the same lens. Opening an account takes a minute. No card.