The business, in plain English
A toll on other people's savings
T. Rowe Price manages money for other people and takes a percentage of it every year. That percentage is currently 38.1 basis points — thirty-eight hundredths of one per cent. On $1.89 trillion, that comes to roughly $7.2 billion of annual revenue, and about thirty cents in every dollar of it drops through to operating profit.
It is a wonderful business model in the abstract. There is no inventory, no factory, no receivable that might not be paid. The fee is deducted automatically from the assets before the client ever sees them. Costs are mostly people, and people can be reduced. When markets rise, revenue rises with them for no additional effort at all.
It has exactly two problems, and they are the same problem. The percentage can fall, and the assets can leave.
This is the whole analysis, and it took no interpretation to produce — it is the company's own table. A record was announced. The record was delivered by the stock market. The firm's own contribution was negative six and a half billion dollars.
We want to be fair about this, because there is a version of the criticism that is unfair. Every asset manager's assets go up when markets go up, and there is nothing dishonest about reporting the total. Rob Sharps, the chairman and chief executive, also said in the same statement that "fundamental active equity remains under pressure" — which is true, direct, and not what a man hiding something says.
But an investor needs to separate the two engines, because only one of them belongs to the company. Markets will do what markets do. Flows are the scoreboard for whether clients want what you sell.
★ What is actually leaking
One asset class, half the firm
| Asset class | AUM, 30 Jun 2026 | % of total | Q2 net flows |
|---|---|---|---|
| ★ Equity | $919.4bn | 48.6% | −$13.5bn |
| Multi-asset | $690.0bn | 36.4% | +$0.4bn |
| Fixed income | $222.3bn | 11.7% | +$4.6bn |
| Alternatives | $61.7bn | 3.3% | +$2.0bn |
| ★ Total | $1,893.4bn | 100% | −$6.5bn |
Three of the four asset classes are growing. The fourth is half the company.
This is not a T. Rowe Price problem. It is the defining structural fact of the last two decades in fund management: money has moved from actively managed equity funds, which try to beat an index, into index funds, which do not try. The index fund charges three or four basis points. T. Rowe charges considerably more, and must therefore beat the index by more than the difference, after tax, reliably, for decades.
Rob Sharps put it plainly on the call: "active equities lost meaningful share to passive", and the migration of clients from mutual funds into ETFs and separately managed accounts has "put pressure on fees".
★ That last point is the one that makes this business genuinely difficult, and it deserves stating twice. T. Rowe's ETF business took in $4.4 billion in the quarter. That is a real success. But money arriving in an ETF at a low fee, while money leaves a mutual fund at a high one, shrinks revenue even when total assets hold. Winning the flow and losing the revenue are entirely compatible, and this company is doing both at once.
Against a headline announcing a record, this is what the chief executive told analysts a week later.
| Rob Sharps, 7 August 2026 | "We expect net flows in the second half of the year to be meaningfully more challenging than the first half, primarily due to ongoing outflows in active equity, especially in open-ended mutual funds and a handful of our growth strategies." |
| And on the target date business | He cited "portfolio rebalancing away from equities" and "an air pocket in the late-stage pipeline" as headwinds to third- and fourth-quarter flows in the firm's most important franchise. |
We give management credit for saying it. A company that wanted to ride the record headline would not have volunteered "meaningfully more challenging" or "air pocket" eight days later. ★ But an investor reading only the press release would have the wrong picture entirely, and that gap between the headline and the guidance is worth more than any ratio in this analysis.
★ What is genuinely good here
A retirement franchise that is very hard to leave
Having made the structural case as hard as we can, here is the other half, and it is stronger than the bears allow.
The largest thing T. Rowe Price owns is not a fund. It is a position inside the American retirement system. Multi-asset assets are $690 billion — 36.4% of the firm — and a substantial part of that is target date funds: the default option in thousands of corporate retirement plans, into which employees' contributions flow automatically, every payday, without anybody making a decision.
- ★ The performance record is genuinely exceptional. Over ten years, 98% of target date assets outperformed their Morningstar peers. That is not a marketing claim about a single fund; it is nearly the entire franchise beating its category over a decade.
- The switching cost is institutional, not personal. Changing the default fund in a corporate retirement plan requires a plan sponsor, a consultant, a committee and a fiduciary process. It happens — but it happens slowly, and it does not happen because a saver read something.
- The flows are automatic and contra-cyclical. Money arrives from payroll deduction whether markets are up or down. ★ This is the closest thing in fund management to a subscription.
- And it is being extended. The Goldman Sachs alliance is producing target date strategies that incorporate private-market assets — the first interval fund has launched, a second is in registration, and a collective investment trust version is, in Sharps's words, "operationally ready to launch as a CIT when client demand materialises".
The honest measure of all this: $30bn of ETFs and $61.7bn of alternatives together are about 4.9% of the firm. They are growing quickly and from a base too small to offset $13.5 billion of quarterly equity outflow. That may change over a decade. It will not change over three years.
★ The balance sheet — and this one needs no correction
Net cash, and a rare case where the screen is telling the truth
We have spent five analyses this week explaining why standard metrics are category errors — for a manufacturer with a captive bank, for two net-lease REITs, for an industrial landlord with a $625m impairment. It is a pleasure to report that for T. Rowe Price the screen is broadly correct.
★ One consequence worth doing the arithmetic on. Strip the net cash out and you are paying roughly $21.3 billion for a business consensus expects to earn about $2.2 billion next year — around 9.7 times, against a headline multiple of 11.0.
Even the discounted cash flow figure from our data feed — $125.51, an implied +11.8% — is, unusually, a plausible number rather than a category error. An asset manager's free cash flow really is free: there is no rate base to fund, no warehouse to build, no lending book distorting the capital expenditure line. We report it here without the health warning we attached to every other company this week.
| Fiscal year | Free cash flow | Dividends | Buybacks | Total returned |
|---|---|---|---|---|
| 2021 (peak) | $3,213m | $1,702m | $1,139m | $2,841m |
| 2023 (trough) | $911m | $1,122m | $254m | $1,376m |
| 2024 | $1,262m | $1,136m | $337m | $1,473m |
| ★ 2025 | $1,479m | $1,143m | $621m | $1,764m |
Note two things. First, the buyback was cut hard in the bad years and restored as cash flow recovered — the correct behaviour, and the same pattern we praised at Deere five days ago. Second, 2025's total return of $1,764m exceeded free cash flow of $1,479m. The difference came out of the cash pile, which the company can afford and which is a deliberate choice rather than a strain — but it is not repeatable indefinitely.
★ The pace this year is what matters for the investment case. Buybacks were $157m in the second quarter and $497m year to date — roughly 2.5% of the shares outstanding in six months. Share count is down to 213.3 million. At that rate the company retires about five per cent of itself a year.
★★ And that is the entire bull case in one sentence, so here it is explicitly: a 4.63% dividend plus a 5% annual reduction in share count is roughly 9.6% a year of shareholder return, before any growth at all and before any change in the multiple. The question is whether the business melts more slowly than that.
The long record — where the profit went
Revenue recovered. Margin did not.
| Fiscal year | Revenue | Operating income | Operating margin | Diluted EPS |
|---|---|---|---|---|
| 2016 | $4,285m | $1,733m | 40.5% | $4.75 |
| ★ 2021 (peak) | $7,672m | $3,710m | 48.4% | $13.12 |
| 2022 | $6,488m | $2,374m | 36.6% | $6.70 |
| 2024 | $7,094m | $2,333m | 32.9% | $9.15 |
| ★ 2025 | $7,315m | $2,189m | 29.9% | $9.25 |
Revenue in 2025 was above the 2021 peak. Operating income was 41% below it, and the margin had fallen from 48.4% to 29.9%. That is what fee compression and rising costs do to an operationally levered business, and it is why the same revenue is worth so much less than it used to be.
To be fair to management, the adjusted numbers are better than the statutory ones. On the company's own adjusted basis, second-quarter operating income was $709.1m on net revenues of $1,907.4m — an operating margin of 37.2%, against 28.3% on a statutory basis, with the gap driven largely by carried interest, acquisition-related amortisation and consolidated fund accounting. Adjusted earnings per share were $2.57, up 14.7% on the year.
But look at what the analysts expect next, because it is the least ambiguous statement in this file.
| Fiscal year | Consensus EPS | Analysts | P/E at $112.30 |
|---|---|---|---|
| 2026 | $10.19 | 8 | 11.0× |
| ★ 2027 | $10.22 | 8 | 11.0× |
| ★ 2028 | $9.83 | 1 | 11.4× |
Flat in 2027 and lower in 2028. Nobody covering this company is forecasting growth. ⚠️ The 2028 figure rests on a single estimate and should be treated as illustrative rather than as consensus — but the direction of the 2026-to-2027 line, which eight analysts do cover, is unambiguous: nothing.
★ Which means the investment case cannot rest on earnings growth, and we are not going to pretend otherwise. It rests on the dividend, the buyback, and the melt being slow.
★ The dividend — is it safe?
Forty years of increases, and look at what the increases have become
T. Rowe Price yields 4.63% and has raised its dividend every year for four decades. It is one of a small group of American companies with a record that long. The payment is not in any danger. The increases are another matter.
| Year | Quarterly dividend | Increase |
|---|---|---|
| 2021 | $1.08 | — |
| 2022 | $1.20 | +11.1% |
| 2023 | $1.22 | +1.7% |
| 2024 | $1.24 | +1.6% |
| 2025 | $1.27 | +2.4% |
| ★ 2026 | $1.30 | +2.4% |
Eleven per cent, then four consecutive years of roughly two. A two per cent increase from a company earning twice its dividend is not a capital-allocation decision. It is a streak being maintained. There is nothing dishonourable in that — but an investor should price a 4.63% yield growing at 2%, not one growing at the 11% the record implies.
★ We have now found this pattern four times in a single day — at Zoetis (15% increases for four years, then 6%, five months before a guidance cut), at Rexford (31% decaying to 1.2%), at NNN (steady at 3%, which is honest), and here. The character of a dividend increase is one of the most reliable pieces of forward information a company publishes, and almost nobody reads it.
| Test | Value | Reading |
|---|---|---|
| ★ Cover on free cash flow | 1.29× | 2025: free cash flow of $1,479m against dividends of $1,143m. ★ Per share: $10.17 of free cash flow against $5.20 of dividend — covered 1.96 times. |
| Payout on earnings | 51.6% | Just over half of profit. Room to fall a very long way before it binds. |
| Funded by | fees | Operating cash flow of $1,753m in 2025 against capital spending of $274m. Not funded by debt. |
| ★ Balance-sheet room | net cash | $4.4bn of cash and discretionary investments against $860m of debt. The company could pay the dividend from its balance sheet for three years while earning nothing at all. |
| ⚠️ Total returned vs free cash flow | 119% | In 2025, dividends plus buybacks were $1,764m against $1,479m of free cash flow. Affordable from the cash pile, deliberate — and not repeatable indefinitely. |
What would force a cut. Almost nothing on any horizon we can see. Free cash flow would have to fall by roughly half and stay there, with the cash pile exhausted. Given a 51.6% payout, net cash and a business that remains solidly profitable even after a nineteen-point margin decline, we regard the dividend as one of the safest in this month's analyses.
The realistic outcome is what the table above shows: a 4.63% yield growing at two per cent, indefinitely. That is a perfectly respectable income holding. It is simply not what forty years of increases makes people imagine they are buying.
Risks and controversies
Verified afresh, 25 August 2026
We searched afresh on 25 August 2026 for litigation, regulatory action and disputes, and found nothing of material significance. As with several companies this week, the risks here are structural rather than legal.
★ The risk we rank first is the one nobody can fix, and it is worth naming precisely. The migration from active to passive equity management is not a cycle, a fashion or a management failure. It is a permanent change in how savers buy investment products, driven by cost arithmetic that does not reverse. T. Rowe Price can slow its share of the loss; it cannot stop the loss. Everything management is doing — ETFs, alternatives, the Goldman alliance, headcount reduction — is an attempt to build a different company underneath the one that is shrinking. On present numbers those efforts are about 4.9% of assets and growing quickly from a small base.
The second risk is that revenue is levered to markets and so is the share price. Assets rose $190.2bn on market appreciation last quarter; in a 25% bear market they would fall by a similar mechanism, revenue would fall with them, and the operating leverage that flatters the good quarters works precisely as hard in reverse. An investor buying TROW is buying a leveraged claim on equity market levels dressed as a value stock, and should size the position accordingly.
The third is the one we would watch quarter by quarter: the effective fee rate. It fell from 39.6 to 38.1 basis points in twelve months, and it falls whether clients arrive or leave, because they arrive into cheaper vehicles than the ones they leave. ★ That is a slow, mechanical, unglamorous erosion of the price of the product, and it will continue for as long as the vehicle migration continues.
⚠️ One note on our own figures: the 2028 consensus earnings estimate rests on a single analyst, and the 2029 figure likewise. We report them for shape and would not build anything on them.
★ Valuation — cheap, and for reasons that are true
The market has already re-rated it once this year
| Measure | Value | Reading |
|---|---|---|
| Share price, 24 Aug close | $112.30 | Market capitalisation $24.06bn; enterprise value $21.26bn |
| ★ 52-week range | $85.22 – $122.00 | 31.8% above the low, 8.0% below the high. ★ The easy money in this idea was made earlier in the year. |
| P/E, trailing | 11.3× | On $10.38 of trailing earnings per share. |
| ★ P/E on 2026 consensus | 11.0× | $10.19 from eight analysts. And 11.0× again on 2027's $10.22 — flat. |
| ★ P/E excluding net cash | ≈9.7× | $21.26bn of enterprise value against roughly $2.2bn of expected 2026 earnings. Under ten times for a business at a 37% adjusted operating margin. |
| ★ Free cash flow yield | 9.04% | $10.17 of free cash flow per share. Price to free cash flow of 11.1×. |
| Dividend yield | 4.63% | $5.20 annualised at a 51.6% payout, covered 1.96× by free cash flow. |
| Price / book | 2.18× | Against a return on equity of 20.4% and return on invested capital of 12.7%. |
| Our DCF feed | $125.51 | +11.8%. ★ Unusually, we do not dismiss this one. An asset manager's free cash flow genuinely is free — no rate base, no lending book, no warehouses. It is a plausible figure rather than an artefact. |
| Consensus target | Mean $114.20, median $116, range $108 to $120. That is +1.7%. ★ The market believes this is worth what it costs — the same conclusion it reached about NNN and Rexford this week. |
| ★ Recommendations | 0 strong buy · 8 buy · 24 hold · 6 sell, from 38 analysts. Consensus: Hold. ★ Sixteen per cent outright sells on a stock at eleven times earnings — the sell side does not think this is a mispricing, it thinks it is a declining business correctly priced. |
| Target history | All-time average $119.72 across 43 targets · last year $109.19 · last quarter $114.00 · last month $115.75. Targets have risen through the year as the share price rose — following, not leading. |
So what does 11.0× assume? It assumes that earnings are roughly flat for several years, that the equity outflow continues at something like the present rate, that the fee rate keeps grinding down a basis point or so a year, and that none of it accelerates. That is not a pessimistic assumption. It is close to a description of what is already happening.
There is no hidden value here to uncover, and we are not going to invent one. What there is, is a straightforward proposition that can be checked with a calculator: a 4.63% dividend, a share count shrinking about five per cent a year, and a business that must decline more slowly than the sum of those two for the arithmetic to work.
On the thirty-first of July, T. Rowe Price announced that it managed a record one point eight nine trillion dollars. It is the largest sum in the firm's ninety-year history and it was the first line of the release.
Here is the rest of the arithmetic, from the company's own table two pages later. Assets rose one hundred and eighty-three point seven billion dollars in the quarter. Market appreciation contributed one hundred and ninety point two billion. Clients withdrew six and a half billion.
Every dollar of the record came from share prices going up. The firm's own contribution was negative.
I want to be fair, because there is an unfair version of that criticism. Every fund manager's assets rise when markets rise and there is nothing dishonest about reporting the total. And the chief executive, Rob Sharps, said in the same statement that fundamental active equity remains under pressure — which is true, and is not what a man concealing something says. Eight days later, on the call, he went further, and I would rather quote him than paraphrase: "We expect net flows in the second half of the year to be meaningfully more challenging than the first half, primarily due to ongoing outflows in active equity."
I give a man credit for that. But I would also observe that an investor who read only the press release would have precisely the wrong picture, and the gap between the headline and the guidance is worth more than any ratio in this file.
Now, what is actually happening?
Money is leaving actively managed equity funds and going into index funds. It has been doing so for twenty years and it will continue, because the arithmetic driving it does not reverse: an index fund charges three or four basis points, T. Rowe charges thirty-eight, and to justify the difference you must beat the index by more than that, after tax, reliably, for decades. Some managers do. Most do not, and savers have worked this out.
Look at where the leak is and you see the whole problem. Equity is forty-eight point six per cent of what T. Rowe manages and it lost thirteen and a half billion dollars in the quarter. Fixed income gained four point six. Multi-asset gained a little. Alternatives gained two. Three taps running, one pipe burst, and the burst pipe is half the house.
There is a subtler injury underneath, and it is the one that will do the long-term damage. The fee rate has fallen from thirty-nine point six basis points to thirty-eight point one in a year. Nobody announced a price cut. It happens because clients leave expensive mutual funds and arrive in cheap exchange-traded funds — often the same firm's, often the same strategy. T. Rowe can win the client and still lose the revenue, and at the moment it is doing both simultaneously. Revenue last year was above the 2021 peak; operating income was forty-one per cent below it, and the margin had gone from forty-eight per cent to thirty.
So much for the case against. Let me tell you what I think is genuinely good, because it is stronger than the bears allow.
The most valuable thing this firm owns is not a fund. It is a position inside the American retirement system. Six hundred and ninety billion dollars sits in multi-asset strategies, a great deal of it in target date funds — the default option inside thousands of company pension plans, into which employees' money flows automatically, every payday, without anybody deciding anything. Over ten years, ninety-eight per cent of those assets beat their Morningstar peers. That is not a marketing line about one fund; it is nearly the whole franchise, over a decade.
Changing the default fund in a corporate retirement plan requires a sponsor, a consultant, a committee and a fiduciary process. It is slow, and it does not happen because somebody read an article. That is about as close to a subscription as fund management gets, and it is why I do not regard this as a melting ice cube in the way I regard some things.
The firm is also building. Thirty-four exchange-traded funds with thirty billion dollars and four point four billion of inflows in the quarter. Sixty-one point seven billion in alternatives through Oak Hill, with twenty-one billion of committed money not yet earning a fee. Headcount down six point four per cent. Underperforming funds being closed — which is unglamorous and exactly right.
And I have to be honest about the scale of it: the ETFs and the alternatives together are about four point nine per cent of the firm. They are growing quickly from a base far too small to offset thirteen and a half billion dollars a quarter walking out the door. Over a decade that may change. Over three years it will not.
Let me turn to the balance sheet, where I have some genuinely good news and a small pleasure. After a week spent explaining why standard financial ratios are useless for a tractor company with a bank inside it, and for three property companies, it is a relief to report that here the screen is telling the truth. T. Rowe Price holds four point four billion dollars of cash and investments against eight hundred and sixty million of debt. Its enterprise value is less than its market capitalisation. Strip the cash out and you are paying about nine point seven times next year's expected earnings for a business running a thirty-seven per cent adjusted operating margin. Even the discounted cash flow model — which produced comic answers for everything else I looked at this week — gives a sensible number, because an asset manager's free cash flow genuinely is free.
And management is using it. Four hundred and ninety-seven million dollars of stock bought back in six months — about two and a half per cent of the company. At that pace it retires roughly five per cent of itself a year.
Which brings me to the only calculation that matters here, and I would ask you to do it with me.
A four point six three per cent dividend. A share count shrinking about five per cent a year. That is nine point six per cent of annual shareholder return before a single dollar of growth and before any change in the multiple. Consensus says earnings are flat next year and lower the year after. So the question is not whether this company is growing. It is not. The question is whether it declines more slowly than nine point six per cent a year.
I think it very probably does, and here is my reasoning. The retirement franchise is sticky and performing. Three of four asset classes are taking money in. The fee erosion runs at something like a basis point a year, not ten. And the balance sheet means none of this has to be solved in a hurry.
But I want to name the thing plainly rather than dress it up: what I am describing is an orderly liquidation that pays you well while it happens. The company shrinks its share count faster than the business shrinks, and the survivor owns more of less. That is a perfectly legitimate way to make money and I have made money that way before. It is not compounding, and anyone who buys this expecting the T. Rowe Price of 2015 will be disappointed for a decade.
One last thing, and it is the most useful habit I can leave you with. Look at the dividend increases: eleven per cent, then one point seven, then one point six, then two point four, then two point four. Forty consecutive years of increases, and the last four are a streak being maintained rather than a decision being taken. I have now found this exact pattern four times in a single day — at Zoetis, at Rexford, at NNN and here. The character of a dividend increase is one of the most reliable pieces of forward information a board publishes, and almost nobody reads it.
So: what would I do?
I would own this for the income and the shrinking share count, and I would not pretend it was anything else. At eleven times earnings, nine point seven excluding cash, with a nine per cent free cash flow yield and a dividend covered nearly twice, you are being paid properly to wait.
But I would note that the shares are thirty-two per cent above their low for the year, that the average analyst target is one point seven per cent away, and that six of the thirty-eight people covering it call it a sell. The market re-rated this once already in 2026 and I was not there for it. At ninety-five dollars — about nine times earnings and a five and a half per cent yield, a level these shares traded through this very year — the dividend and the buyback alone would carry the case even if earnings slipped. At a hundred and twelve it is fair rather than generous.
I would take a position and I would keep room to add. And I would watch one number above all the others, once a quarter: not the assets under management, which the stock market decides, but the net client flow, which the company earns. That is the only line on the page that tells you whether anybody still wants what T. Rowe Price sells.
But You Are Paid To WaitAn orderly decline that pays you well while it happens. ★ 4.63% dividend plus a ~5% annual reduction in share count is ≈9.6% of return before any growth — and consensus forecasts none. The question is simply whether the business melts more slowly than that, and we think it very probably does: the target date retirement franchise is sticky and beating its peers 98% of the time over ten years, three of four asset classes are taking money in, and the fee erodes about a basis point a year rather than ten. Own it for the income and the shrinking share count; do not buy it expecting compounding. ⚠️ But note the shares are 31.8% above the year's low with the consensus target 1.7% away — the re-rating already happened. Take a position, keep room, and add toward $95 (≈9.3× earnings, a 5.5% yield). ★ Watch net client flows, not assets under management: one the company earns, the other the stock market decides.
Articles that take this apart
 MarketShould you just buy the index?A research house is the last place you would expect an honest answer to this. So here is ours, with our own scorecard attached and nothing removed.
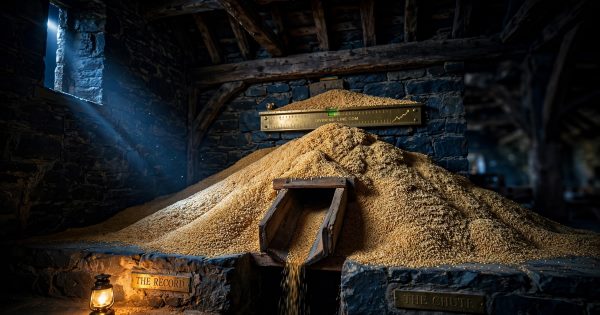 MarketHow to read a record quarterEvery record is made of two things: what you earned and what the tide gave you. Companies report the total. Separating them takes one subtraction.